Table of Contents
One Metric to Rule Them All: How to Get the Whole Enterprise Speaking the Same Language
Almost inevitably in multi-faceted enterprises, different departments – from HR to IT to operations – tend to retreat to their own territories, making it difficult to measure bottom-line performance across the broader organization. Part of the problem with this kind of siloed approach is that the KPIs from one department – say, percentage of tickets resolved in IT or number of product recommendations for retail associates in customer service – often don’t translate to another.
But when the board of directors is looking for productivity updates or areas to cut costs, you need universal KPIs.
When you need to evaluate the effectiveness of a digital transformation initiative, you need universal KPIs.
Essentially, whenever you need to measure bottom-line performance across the full organization, you need universal KPIs.
Looking at quantified data on work and employees’ everyday activities is a way to get everyone on the same page and get every department measuring those big-picture metrics. And when you start to get those kinds of work friction insights, you’ll be able to bridge the silos and get the whole organization speaking the same language.
Work Friction Measures What Gets in the Way of Work
Many organizations tend to lack a clear understanding of their employees’ day-to-day work – particularly those moments when they run into obstacles to performing their best. As a result, many big decisions are based on assumptions that fail to take into account the voice of the worker. Work friction looks to remedy this problem by using data to better define and quantify the critical moments and pain points of employees’ everyday experiences.
What’s the potential value of knowing where work friction lies within your organization? Gartner research has found that dealing with work friction occupies two hours a day for two-thirds of employees in a given company. For an organization with 10,000 employees, that’s 3.1 million hours – the equivalent of 1,568 FTEs – and $78.4 million lost per year.
While each department in an organization has different job-specific goals and metrics, work friction is something that can be reliably measured across the entire organization. In reviewing and analyzing that data, not only can you determine what needs fixing, but also which fixes to prioritize. And when you put those solutions in motion, you can more easily determine how well they’re working through metrics like cost savings and productivity increases.
Reduce Work Friction to Increase Productivity and Reduce Costs
No matter the specialized function of any group of employees, they inevitably have pain points in their day-to-day work that impact their ability to maximize productivity. That’s why reducing work friction can and should be a goal in every department.
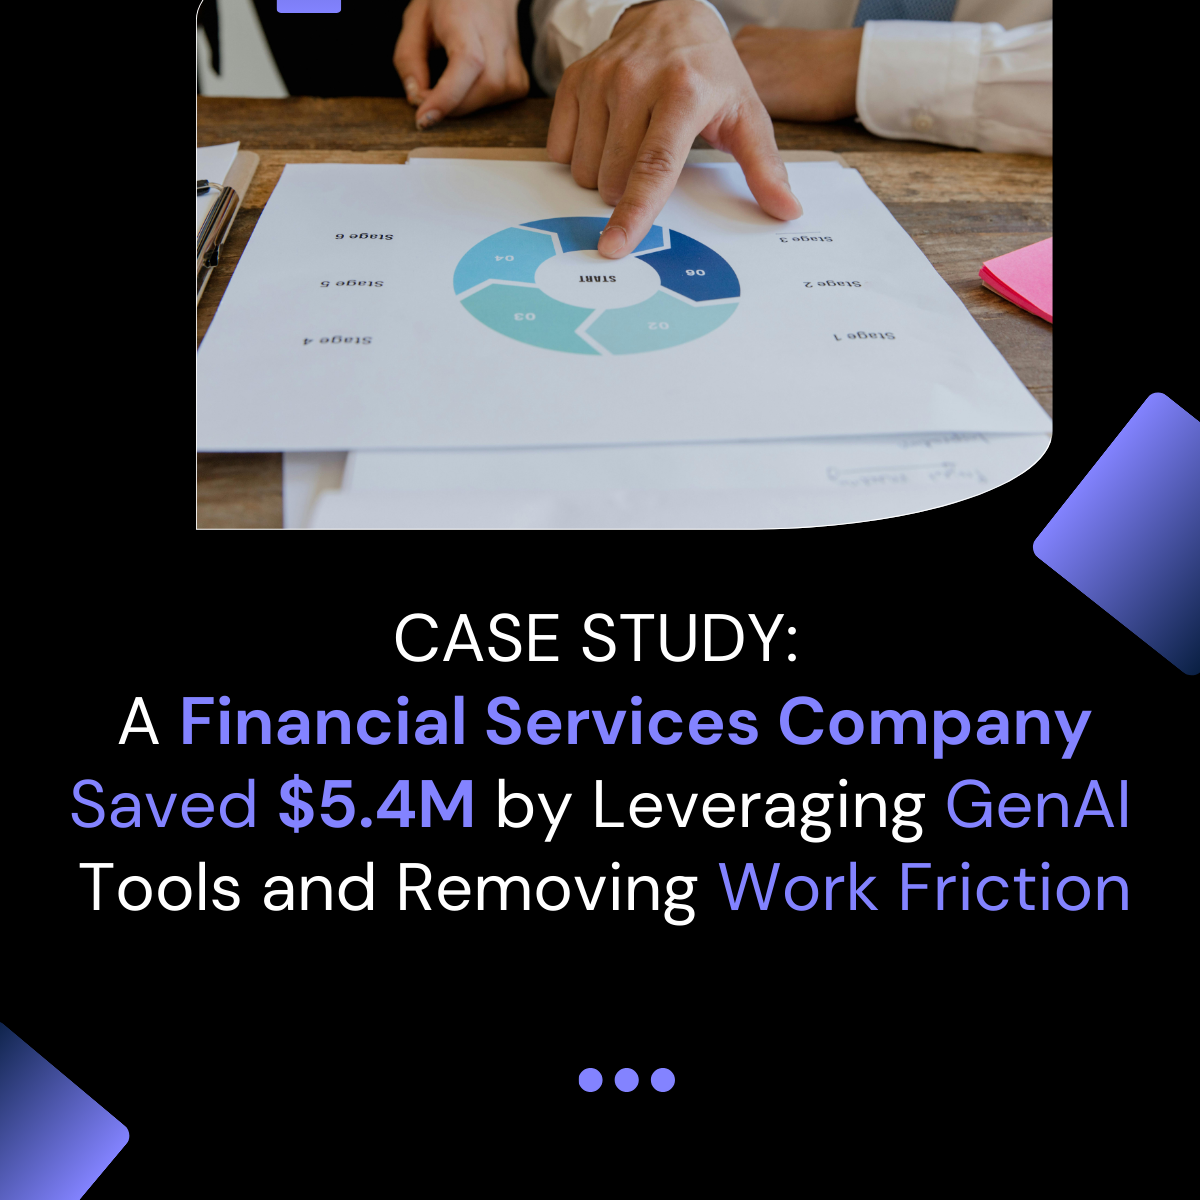
For example, we recently worked with a financial services company that was looking to increase productivity among its 1,000-person software development team by deploying AI chatbots and code assistants to save time and eliminate repetitive manual tasks. In practice, however, the company ran into lackluster adoption from the team and ultimately found it nearly impossible to quantify the benefits of these tools.
What the company really needed to understand was how the AI tools were impacting its developers’ daily activities. By focusing on identifying and measuring their work friction, the company could better understand why the AI tools weren’t being used to their full capacity among the team and target friction management efforts to the specific areas of work friction that developers were experiencing.
By pivoting the AI rollout based on work friction data, the company was able to better demonstrate to the developers how the technology could facilitate their day-to-day work. The developers, in turn, could better see the promised results and were therefore more inclined to use the tool. As a result, the organization was able to realize the productivity increases and cost savings (to the tune of $5.4 million) it had hoped the tools would provide.
Reduce Work Friction To Decrease Attrition
While not a major concern for many organizations right now, employee attrition tends to be a recurring (and costly) issue. In fact, according to research from McKinsey, employee disengagement and attrition could cost a median-size S&P 500 company between $228 million and $355 million a year in lost productivity – that’s at least $1.1 billion in lost value over five years. Here again, reducing work friction can help.
We recently worked with a retail logistics group that was experiencing severe capacity restraints, increased overtime and onboarding costs, and higher error rates due to spiraling attrition among its first-year warehouse order selectors. While the company had increased salaries and rolled out enhanced benefit packages to stem the tide, none of these expensive measures had worked.
But by studying the first-year employees’ work friction – including day-to-day pain points involving training, warehouse navigation, and shift scheduling – the company was able to implement a number of targeted solutions, communication plans, and new processes that directly addressed their most pressing concerns. The result was a 35 percent reduction in first-year turnover that translated into annual cost savings of more than $4 million.
Focus on the Specific to Measure the Universal
For many large organizations, a siloed approach to different departments has become something of a default setting. And it’s a setup that makes it almost impossible to find KPIs that resonate across the full organization.
But while work may vary from department to department, focusing on work friction is a way to uncover actionable insights on bottom-line metrics – including productivity, efficiency, cost savings, time management, attrition, and more. The key is to make sure you’re getting the full picture of work friction by basing your conclusions on solid data. We can help.
Related Resources
See all News
FOUNT News
LIVE Webinar. Beyond AI Hype: How to De-Risk Your GBS Transformation with Friction Data

Guest Post
3 Signs Your GBS Is Creating Friction Instead of Flow (And How to Fix It)

FOUNT News
June Newsletter: Friction is Killing Your AI ROI.
Insights
Breaking the False Tradeoff in GBS: Efficiency vs. Experience

Events
LIVE Webinar – July 9th for SSON Network. Beyond AI Hype: How to De-Risk Your GBS Transformation with Friction Data

Insights
To Create New Value, GBS Leaders Need Different Data
Insights
How to Keep Up with the Latest AI Developments

Insights
APRIL Newsletter. Friction: You Can’t Improve What You Can’t See
