.svg)
With thanks to Stephanie Denino for sparking this line of thinking in her recent LinkedIn post
Traditionally, GBS has been optimized for one primary goal: reducing costs through efficiency. The KPIs have reflected this focus – cycle time, accuracy, cost per FTE.
But those metrics no longer tell the whole story. Expectations have changed. GBS leaders are now tasked with driving transformation, improving adoption, and delivering more value – with no additional resources. The current data isn’t enough.
The New GBS Imperative: Experience as a Strategic Lever
According to industry research:
- 35% of GBS leaders plan to prioritize internal customer experience within three years, recognizing that outdated efficiency-only models fail to address hidden costs like low adoption and rework (Deloitte).
- 44% now view customer centricity as a top strategic priority, according to SSON, with leaders emphasizing trust-building and user-centric design to drive long-term value.
This shift reflects a critical realization: efficiency and experience are interdependent.
“When employees struggle with fragmented tools or unclear processes, costs rise – even if SLAs are met.”
The Myth: Better Experience Means Higher Costs
There’s a common misconception that improving experience comes at the expense of efficiency. In reality, the opposite is often true:
“Efficiency isn’t the opposite of care. Often, it is the care.” – Stephanie Denino , Managing Director TI People
“The false choice between efficiency and experience is what holds so many GBS teams back! If it’s hard to use, it’s expensive to run” – Isabella Kosch , Transformation Consultant, ex-Head of GBS Service Management at Swarovski
Poor experience drives cost – through escalations, delays, abandonment, and low productivity. According to Gartner , poor employee experience contributes to higher turnover, more errors, and lower overall output.

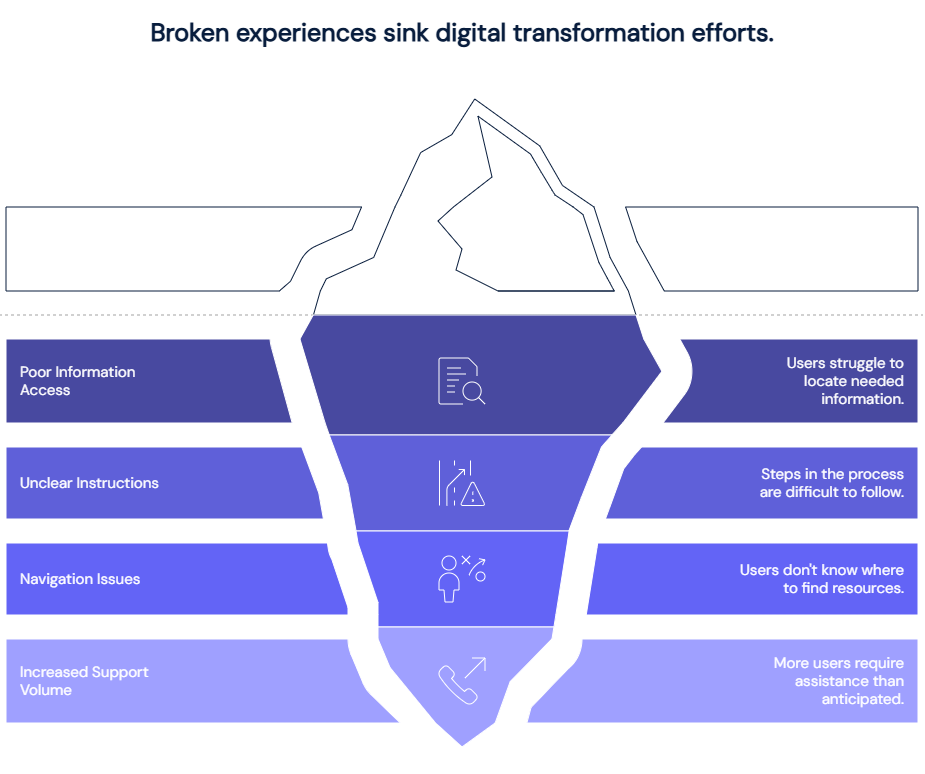
What Poor Experience Looks Like
Imagine a new digital process aimed at reducing FTEs and increasing self-service. On paper, everything checks out – UAT passed, change management completed, SLAs met.
But employee frustration persists:
“I couldn’t find the answer.”
“I didn’t understand the steps.”
“I didn’t know where to go.”
As a result, support volume unintentionally rises, rework increases, and ROI stagnates. Why? Because the process was technically sound, but the experience was broken.
Why Traditional Metrics Fall Short
Most GBS teams rely on lagging indicators:
✔️ SLA breaches
✔️ Ticket volumes
✔️ Post-implementation NPS
✔️ System usage
These signals tell you what went wrong after the damage is done – but not why or where employees are getting stuck.
A met SLA for HR inquiry resolution doesn’t explain why 40% of employees abandon self-service portals. High system usage metrics might mask frustration with clunky interfaces that waste 2–3 hours per employee weekly.
And since IT, HR, and Operations often own different parts, the full experience remains uncoordinated.
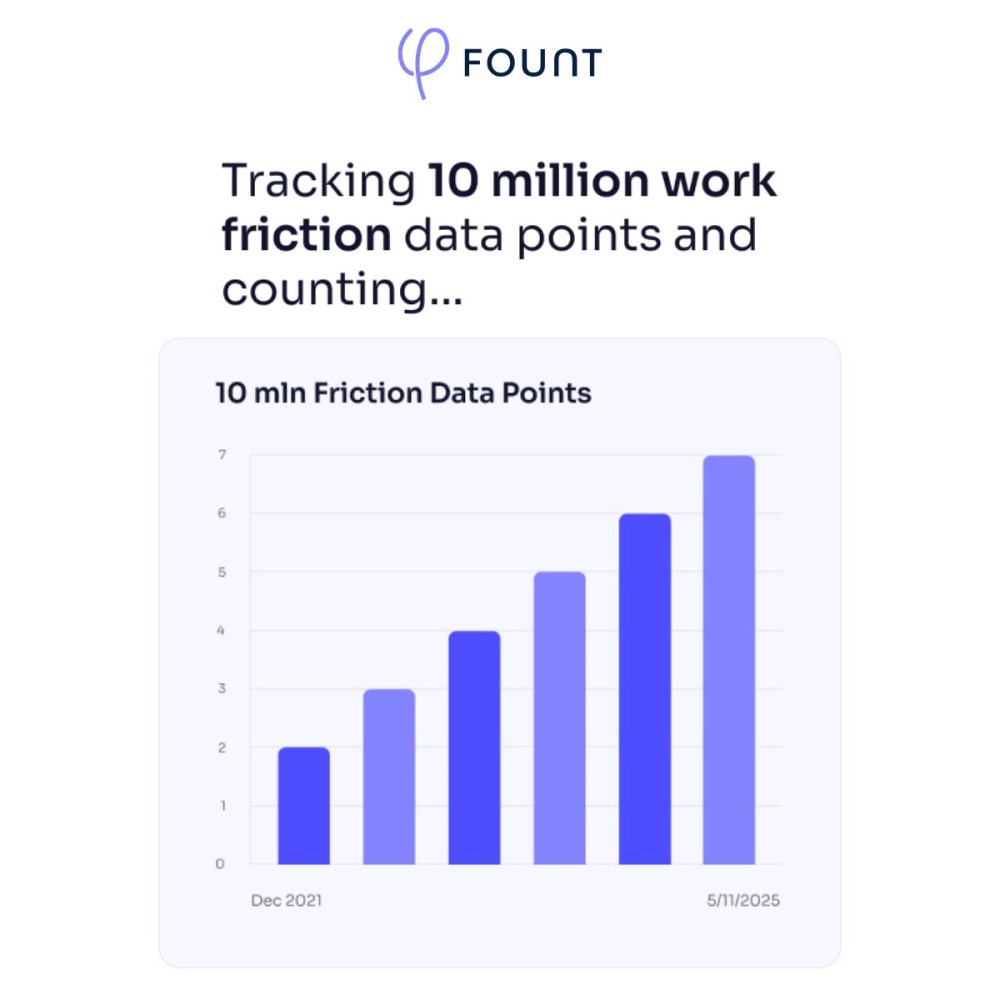
The New Approach: Friction Data
Forward-thinking teams are now adopting friction data – a new measurement layer that reveals:
- Where work is breaking down
- How much time is being wasted
- Which tools or touchpoints cause frustration
- How to resolve issues proactively, before costs escalate
This structured data (like what FOUNT provides) allows GBS leaders to identify root causes of:
- Rework
- Abandonment
- Poor tool adoption
- Low productivity
It offers a shared view across silos- creating a roadmap for continuous improvement.
A Case in Point
At one global pharmaceutical company, friction data revealed a breakdown in the performance management process. The insights led to a redesign that:
- Saved over 30,000 hours
- Avoided $3.49M in costs
- Increased employee satisfaction by 22%
The Power of Reducing Friction
When friction is reduced:
- Employees need less support
- Tools are adopted more reliably
- Processes run closer to their intended design

You’re not overspending because you care too much about experience. You’re overspending because friction hampers adoption and inflates support costs.
To transform GBS from a cost center into a strategic value driver, you need more than dashboards and CSAT scores. You need visibility into how work actually feels – and where it’s breaking down – so you can actively improve it.
Sources:
- https://www.linkedin.com/posts/stephaniedenino_betterwork-ex-gbs-activity-7336382847592652802-A9IJ?utm_source=share&utm_medium=member_desktop&rcm=ACoAAAawMR8Bi7QFEzpwn_7YqdGYqwd5znLfG2o
- Chief Executive: Expanding GBS Adoption Through Increased Focus On Customer Experience
- SSON: Creating a Customer-Centric GBS: Focused Goals, Feedback & Vision
- Harvard Business School Online: Customer Experience Management Strategies for Brand Loyalty
- Psico-Smart: What are the hidden costs of neglecting employee experience management?
Register for the Upcoming Webinar, organized by SSON Beyond AI Hype: How to De-Risk Your GBS Transformation with Friction Data
.webp)


.png)


.svg)
.svg)