Table of Contents
Measure What Matters: Building a Common Data Model and Governing Structure to assess the impact of AI and Digital Transformation
You’ve just embarked on your AI Transformation and introduced some new AI tools in your organization. Ok, how do you know they are working? Did they increase your team’s productivity? If so, how do you measure that?
by Andrei Airimitoaie, Head of Product at FOUNT Global
KEY TAKEAWAYS
- What ultimately matters in a successful deployment of an AI project is its impact on people’s productivity.
- To measure productivity, look at a combination of leading indicators, including satisfaction, effort and time spent on tasks (before and after the introduction of an AI tool).
- When leading indicators are negative, dig into people’s feedback for ideas on how to address high-friction areas.
- Rinse and repeat until your AI project is ROI positive.
Despite AI’s continued dominance in business headlines, only four percent of organizations are currently driving “substantial” value from the technology. Even more telling: less than a quarter have moved past the proof-of-concept stage to drive any value at all.
So what are these leading companies doing differently from everyone else? For one thing, they’re setting ambitious, concrete targets for how AI will improve their business operations. That means they have a system for measuring the impact AI investments are having on their bottom line.
In this piece, we will explain how you can create this system. Read on for an overview of how to measure the impact of an AI tool and how to adjust course to ensure your AI investments stay ROI positive.
What Matters to an AI Project?
The problem is that most organizations don’t have any systems in place for measuring productivity. They may have data on employee sentiment, usage and survey data on their tools, but neither of those methods give an accurate or full picture of productivity. Furthermore, most organizations lack a common data model and governance structure to assess productivity and AI user adoption across the board.
The main reason behind this is because the existing methods are missing the user’s workflow perspective. Put simply, how is this new tool helping me get this particular job done?
This is where FOUNT’s approach comes in. With a data model that can be applied across roles or business areas, our system quantifies the performance of AI tools across workflow activities.
How to Measure an AI Tool’s Impact on Productivity
To assess an AI tool’s impact on productivity, we look at where work friction crops up in specific work moments the tool affects. What are “work moments”? They’re specific activities or jobs to be done that workers carry out throughout their day.
To get a clearer picture, let’s dive into an example. A financial services organization introduces an AI tool to its software developer team to increase their productivity. To assess this, our platform will send targeted micro-surveys to a subset of the development team, which assess work moments such as:
- Trying to find an answer in the codebase.
- Debugging code.
- Opening a pull request.
- Reviewing a pull request.
- Writing technical documentation.
For each of these moments/activities, we’ll ask questions such as:
- How is your experience with <moment>?
- When was the last time you had to perform <moment>?
- How long do you estimate it took you to perform <moment> the last time?
- To what extent do you agree with the following: The way we do this minimizes unnecessary time waste.
These surveys are sent from our platform or distributed via existing survey tools and take as little as 2-3 minutes to complete.
Once the results are in, we plot work moments on a prioritization matrix (Figure 1).
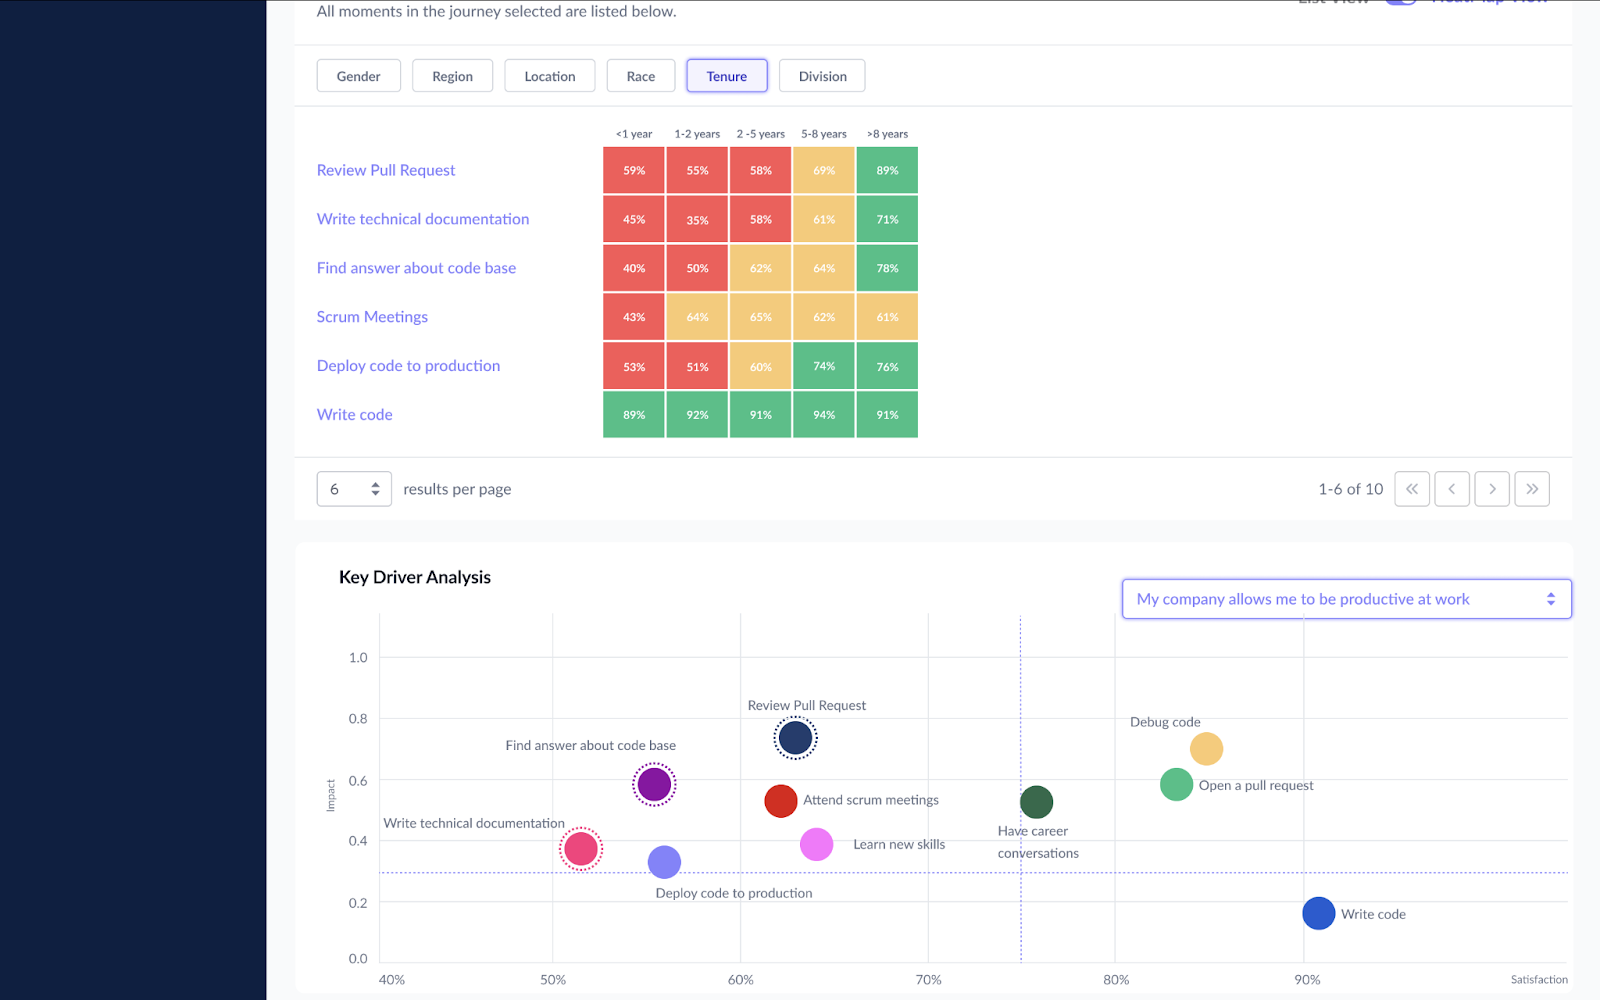
In the upper-left quadrant are moments that have a high impact on productivity but low satisfaction scores. These are your main problem areas. Start here first to get the biggest bang for your buck on your AI initiatives. You can also use this matrix to identify areas that could benefit from future AI investment.
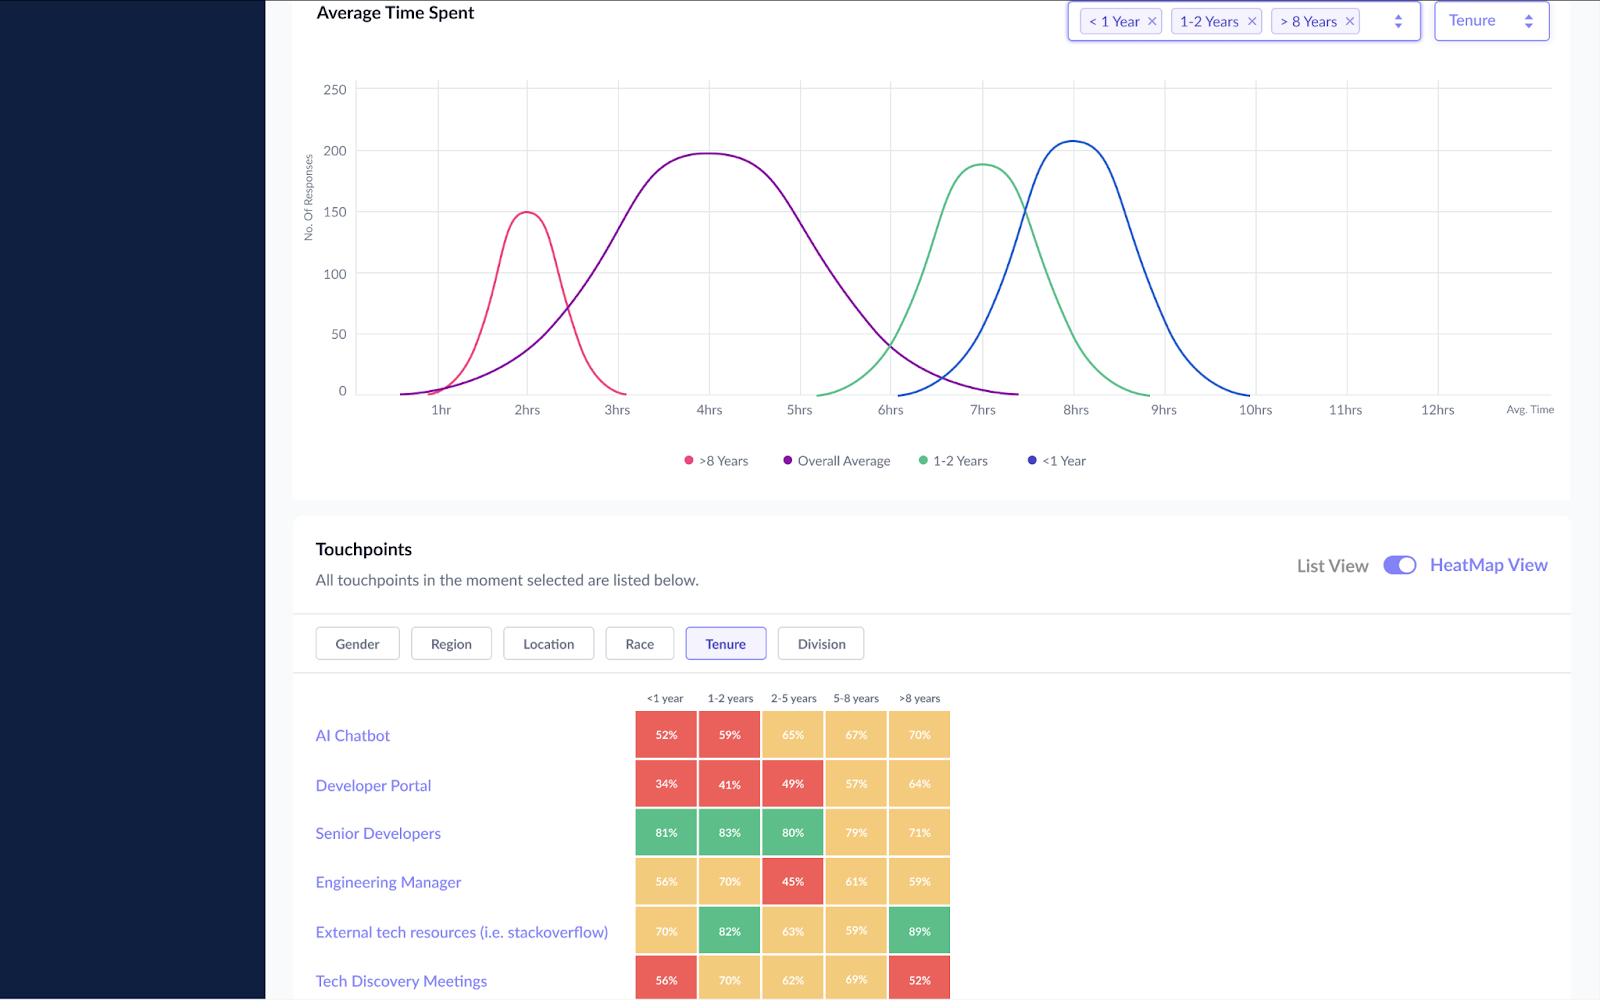
Next, for each high friction/high impact work moment, look for how much time people spent on this activity, as well as the tools, processes or people that either enable this activity or cause friction. We call these touchpoints (Figure 2).
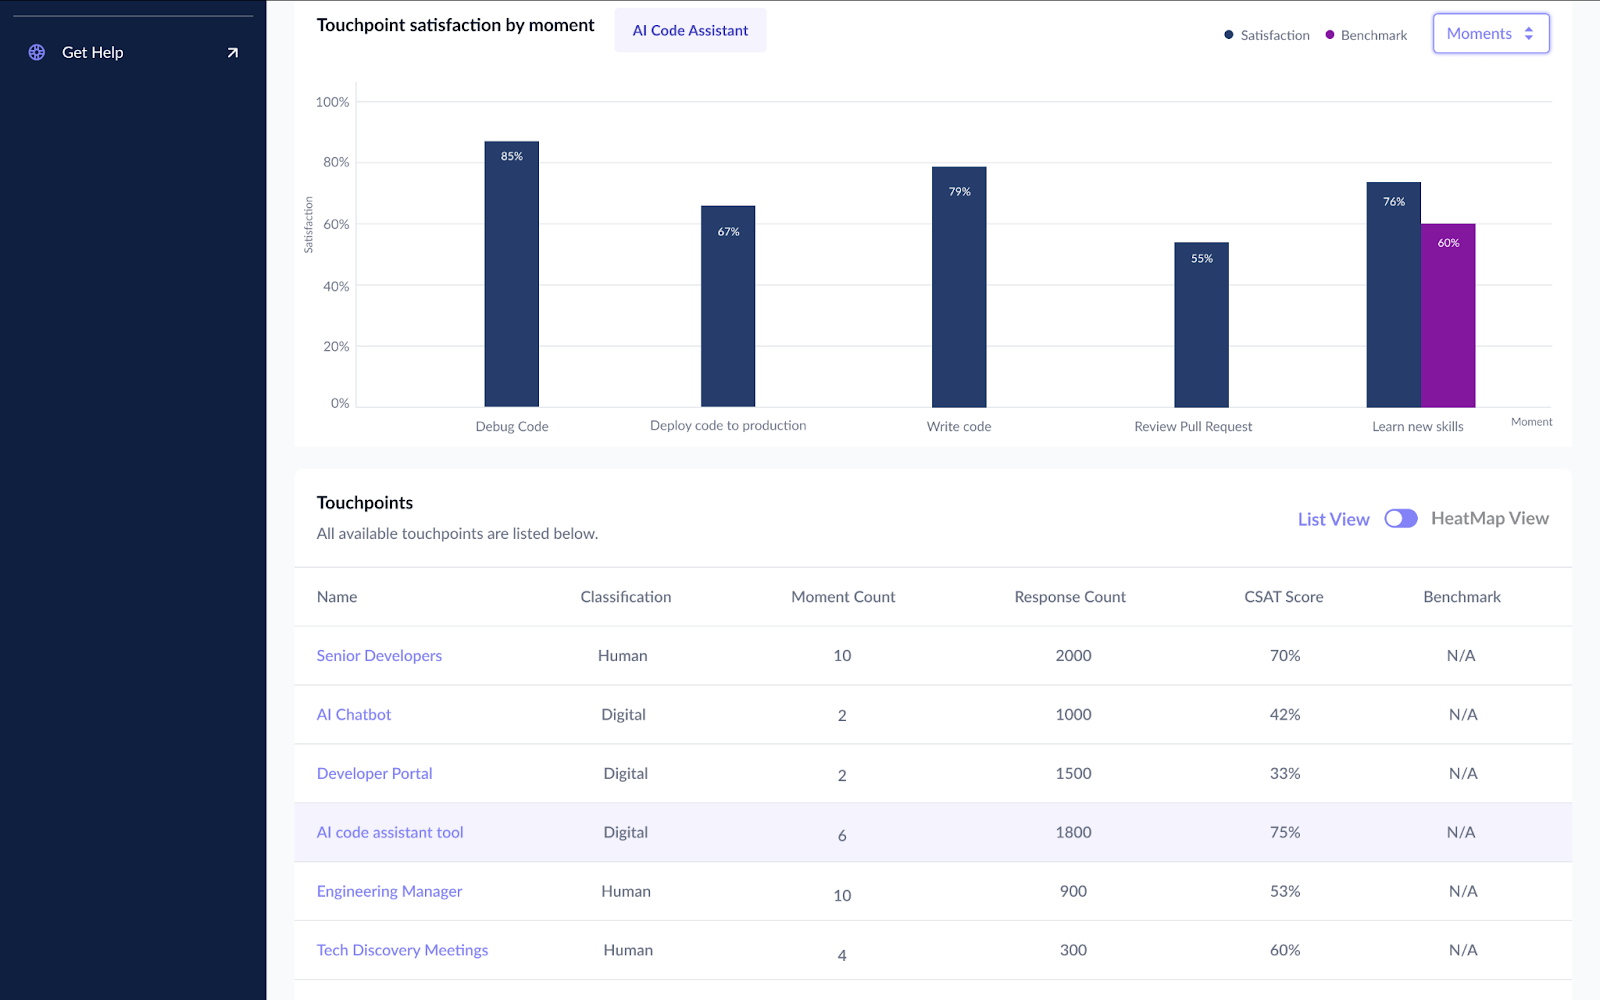
For each of your AI tools, you will get a full picture of its performance and satisfaction across multiple workflow activities. For instance, if we look at the AI code assistant that the organization implemented, across 5 different activities, we identify where the tool excels and where it falls short (Figure 3).
Dig into the user’s perspective to find out what is not working and how to fix it
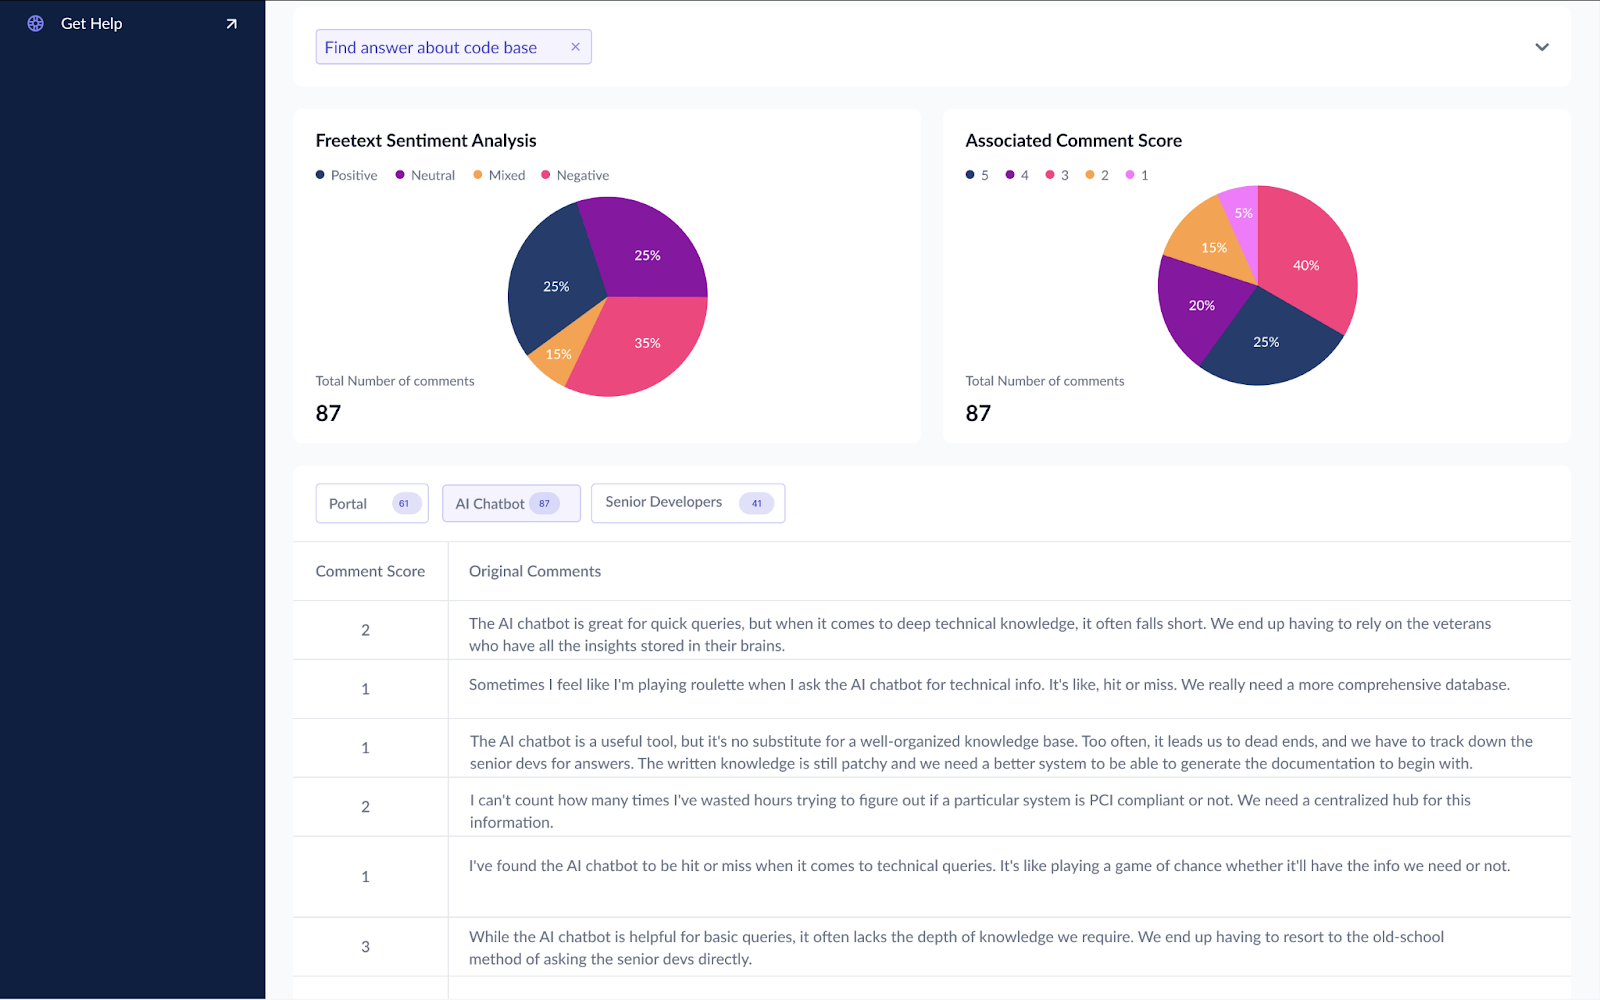
Look at qualitative data:. Quantitative survey data will show you which work moments need to be improved to deliver a positive ROI. If you’re not sure how to improve the status quo, you can turn to qualitative data, which we gather in the form of open-ended survey questions. You can use our AI-powered analysis to dive into specific comments and discover what are the precise issues and how to fix them(Figure 4). These free text comments provide direct context about the specific task at hand, unlike standard survey tools.
How to Turn Your AI Projects ROI-Positive
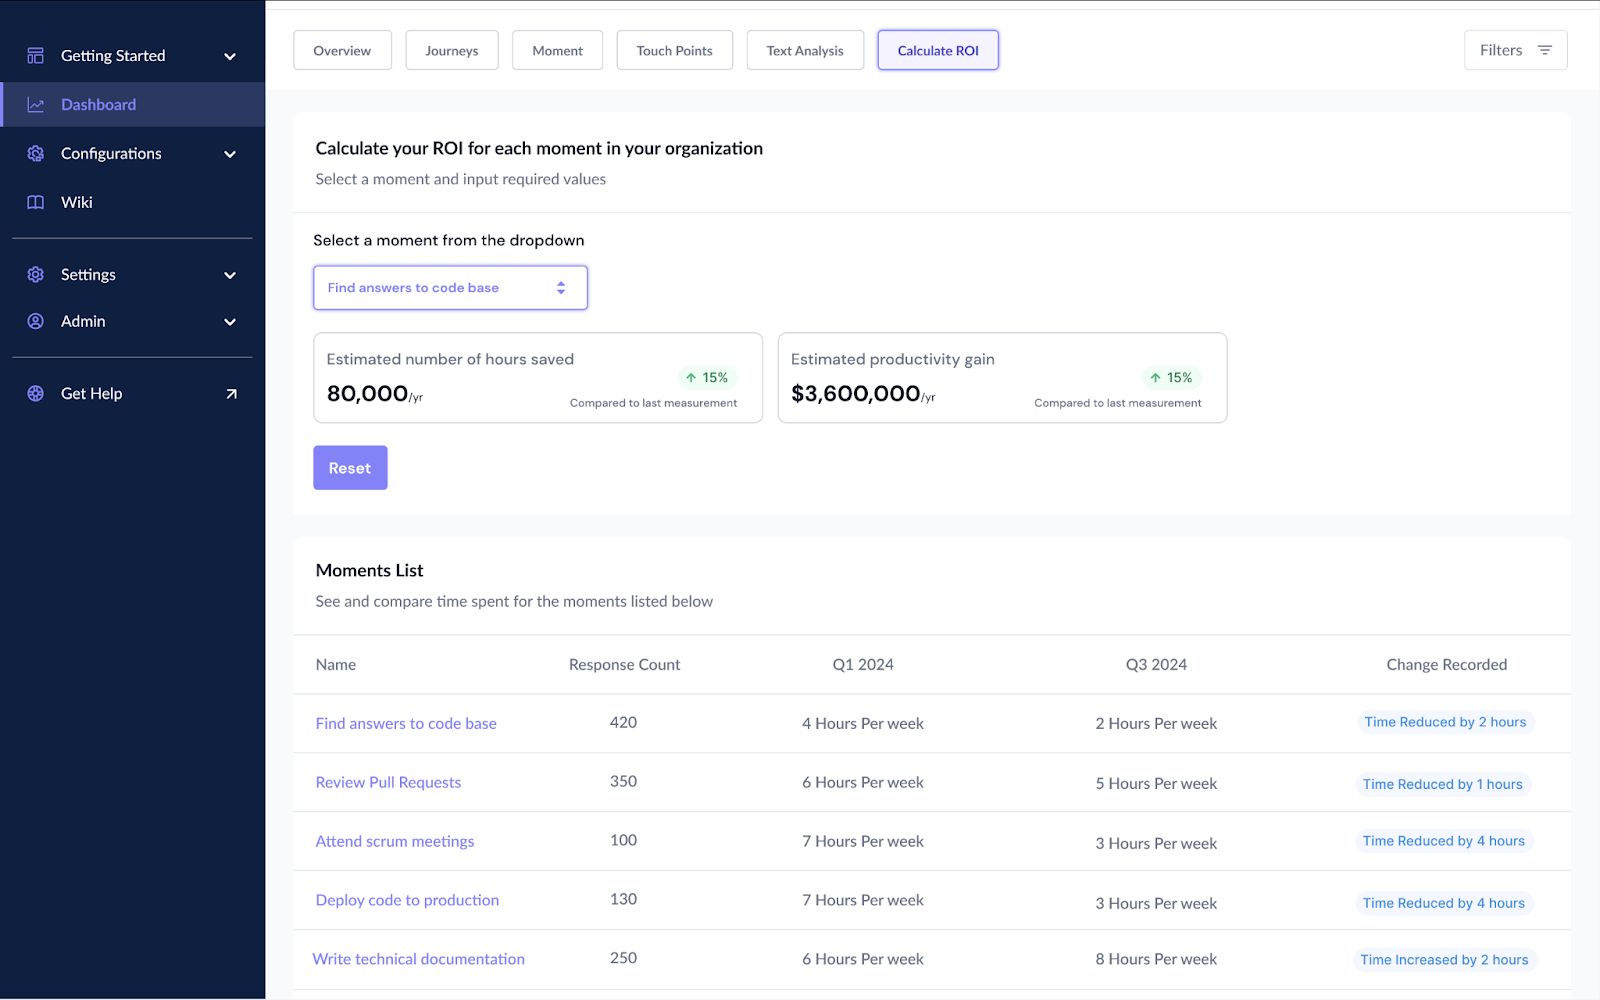
Use the combination of quantitative and qualitative data to take a targeted action. After making a change, it’s important to re-survey your workers to see if the change resulted in the desired productivity outcome. Our platform is able to show how much time and money companies can save by removing friction in key daily activities of their employees and ultimately ensure that their AI investments are paying off by quantifying the impact on productivity (Figure 5).
AI Transformation Success Starts with Measuring the Right Things
AI’s potential to transform businesses is significant: the organizations currently leading in AI transformations are aiming for more than $1 billion in revenue increases from productivity savings.
If your organization is among the 96 percent that hasn’t yet cracked the code on turning AI technology into real business value, now is a great time to start measuring leading indicators of your AI tools’ success. And if you haven’t yet adopted any AI tools, now is an excellent time to assess work friction to see where AI could have the biggest impact in your organization.
When you’re ready to discuss your next steps, don’t hesitate to reach out.
Related Resources
See all News
FOUNT News
June Newsletter: Friction is Killing Your AI ROI.
Insights
Breaking the False Tradeoff in GBS: Efficiency vs. Experience

Events
LIVE Webinar – July 9th for SSON Network. Beyond AI Hype: How to De-Risk Your GBS Transformation with Friction Data

Insights
To Create New Value, GBS Leaders Need Different Data
Insights
How to Keep Up with the Latest AI Developments

Insights
APRIL Newsletter. Friction: You Can’t Improve What You Can’t See

Guest Post
AI is Reshaping the HR Operating Model: Here’s What 15 Leading Companies Discovered
Insights
5 Friction Trends for 2025
