You're putting AI
into workflows
you can't see
Get an X-ray of employee workflows
FOUNT reveals how your employee workflows actually unfold, so you can redesign based on reality and make AI work for the people doing the job.
.webp)
Trusted by enterprise leaders at


.svg)
.svg)

.svg)


.svg)

.svg)
.svg)
When you can’t see the employee workflow, your AI efforts
don’t unlock full value.
Existing methods to analyze
people's
workflows don’t cut it.
.svg)
Redesign looks right on paper, not in practice
The picture you redesign from – process maps, job descriptions, select interviews – don’t reflect the full messy reality workers face.
Re-designs with AI overlook opportunities & issues that jeopardize AI adoption and value.
.svg)
Adoption is up, yet business value isn’t
The signals you’re watching track usage and clicks, or lagging results.
None measure whether workers are reaching their outcomes faster, easier, or better – and what to do if they aren’t.

You don't know what to scale, fix, or stop
When something works, you don’t have enough evidence to scale or replicate what triggered productivity gains.
When something underperforms, you can’t tell whether to fix it or kill it entirely.
See what’s really happening in
employee workflows – from the worker’s perspective.
Map the workflows
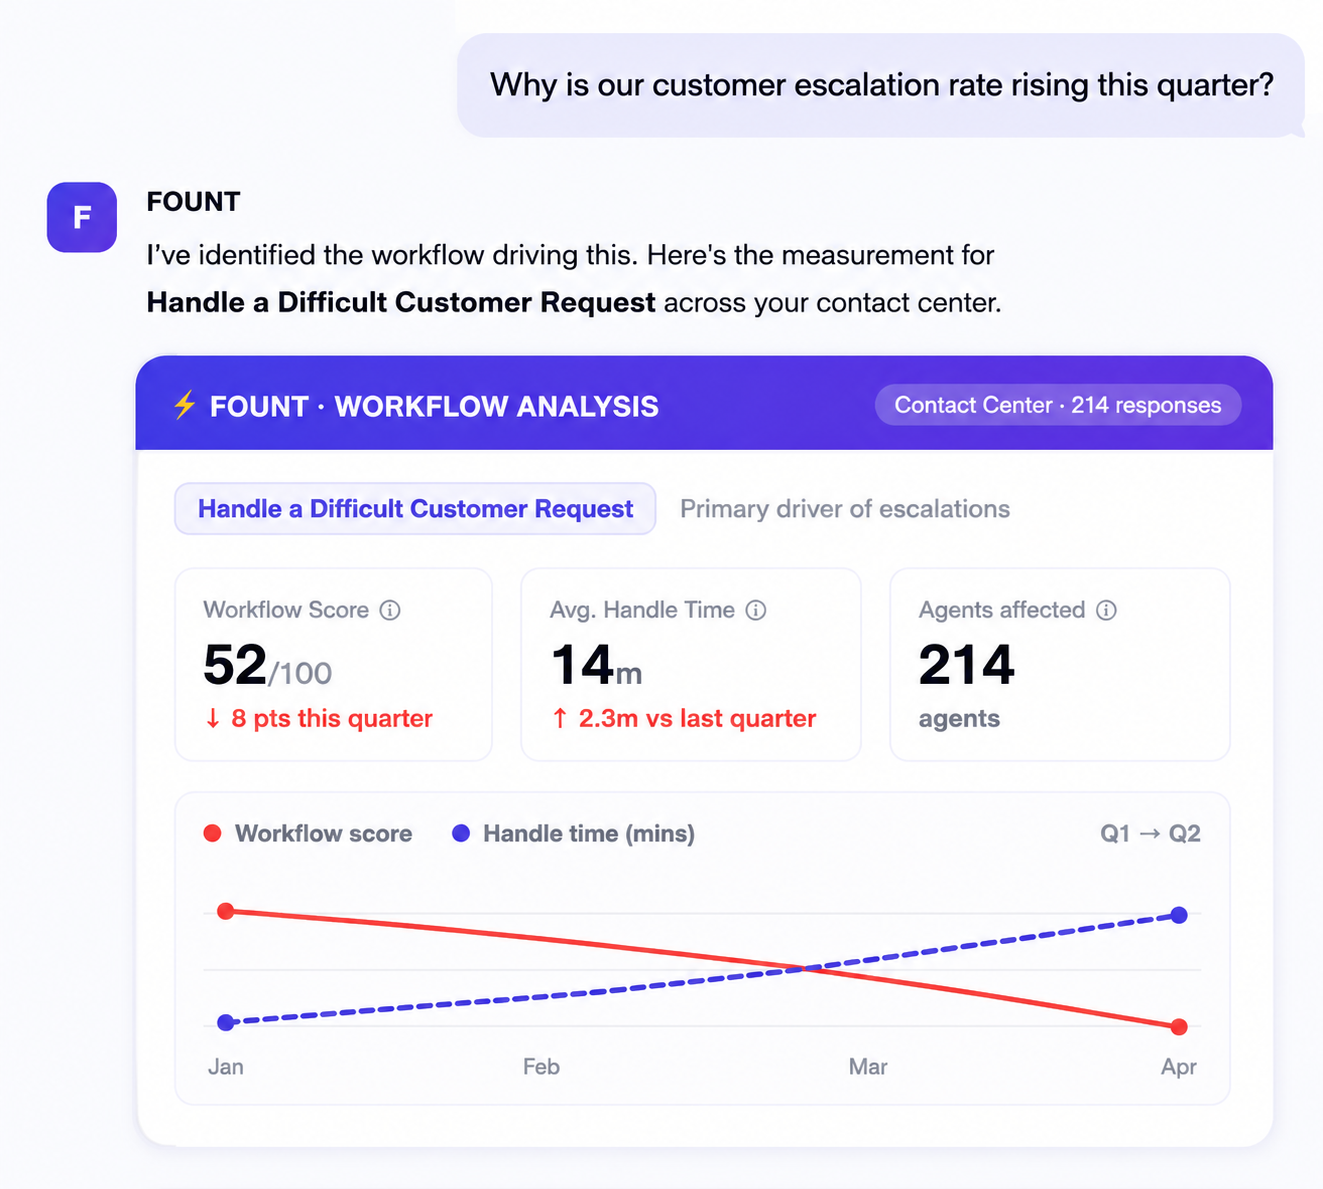
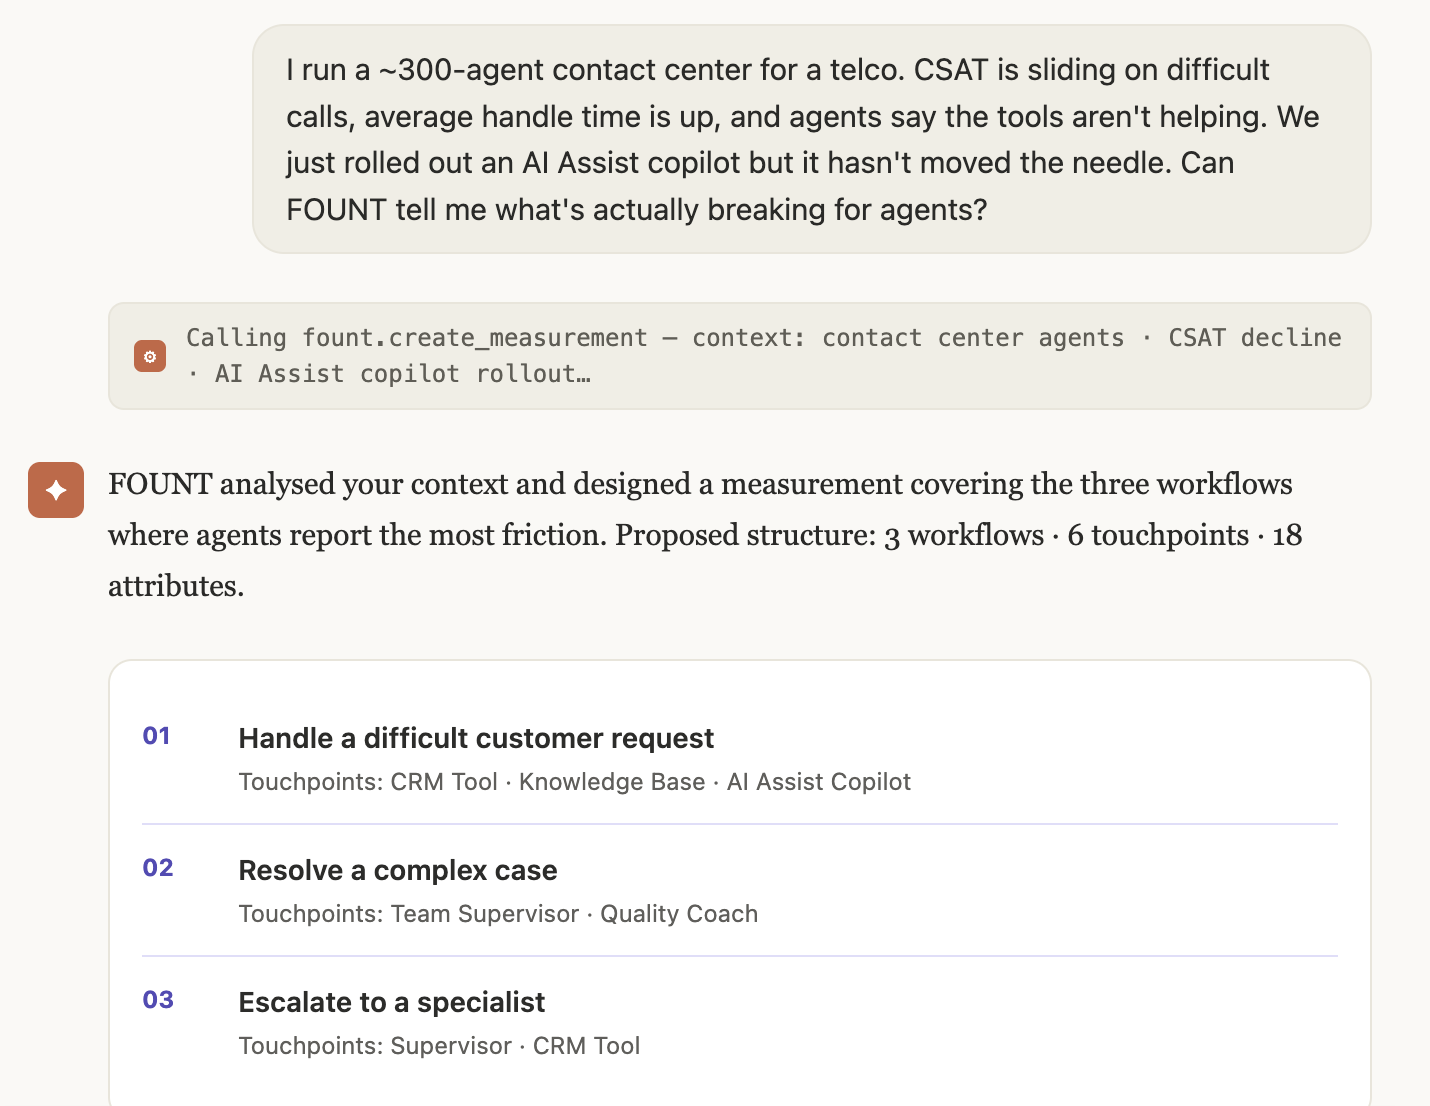
Bring a transformation plan or business problem you’re trying to solve, FOUNT helps you identify which employee workflows to measure, and what to ask about each.

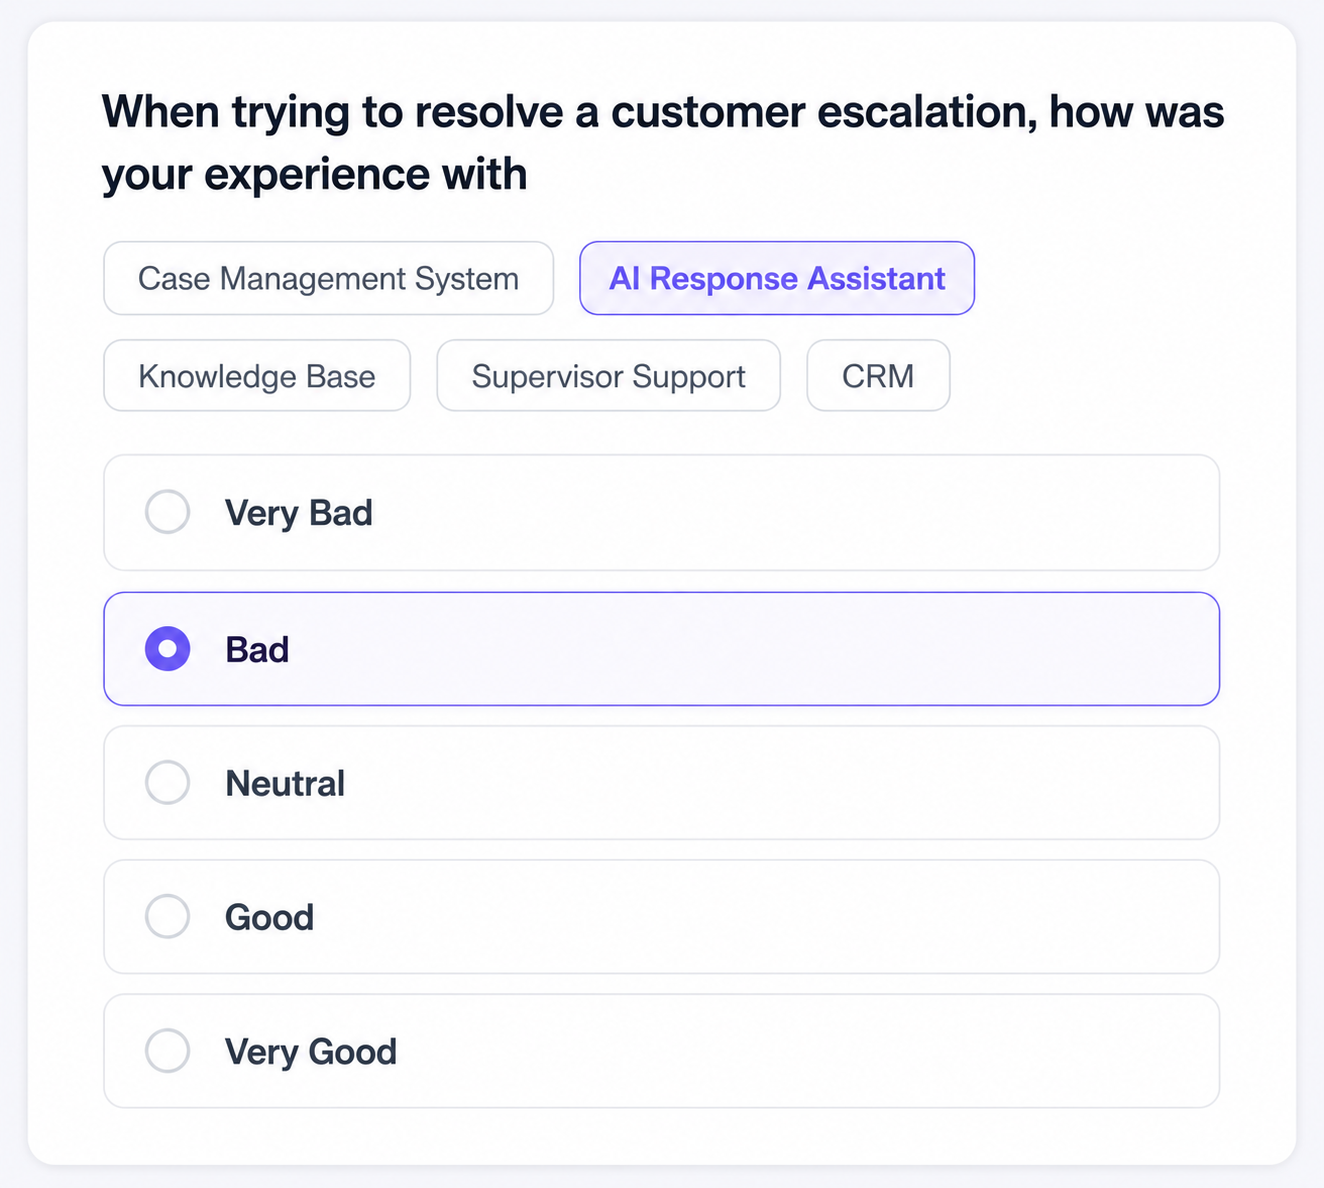
Hear from workers
FOUNT asks workflow-specific questions about what’s going well, what’s not, and what workers would change. Less than 2 minutes from a small number of workers to give feedback on one workflow – enough to be statistically robust, not anecdotal.
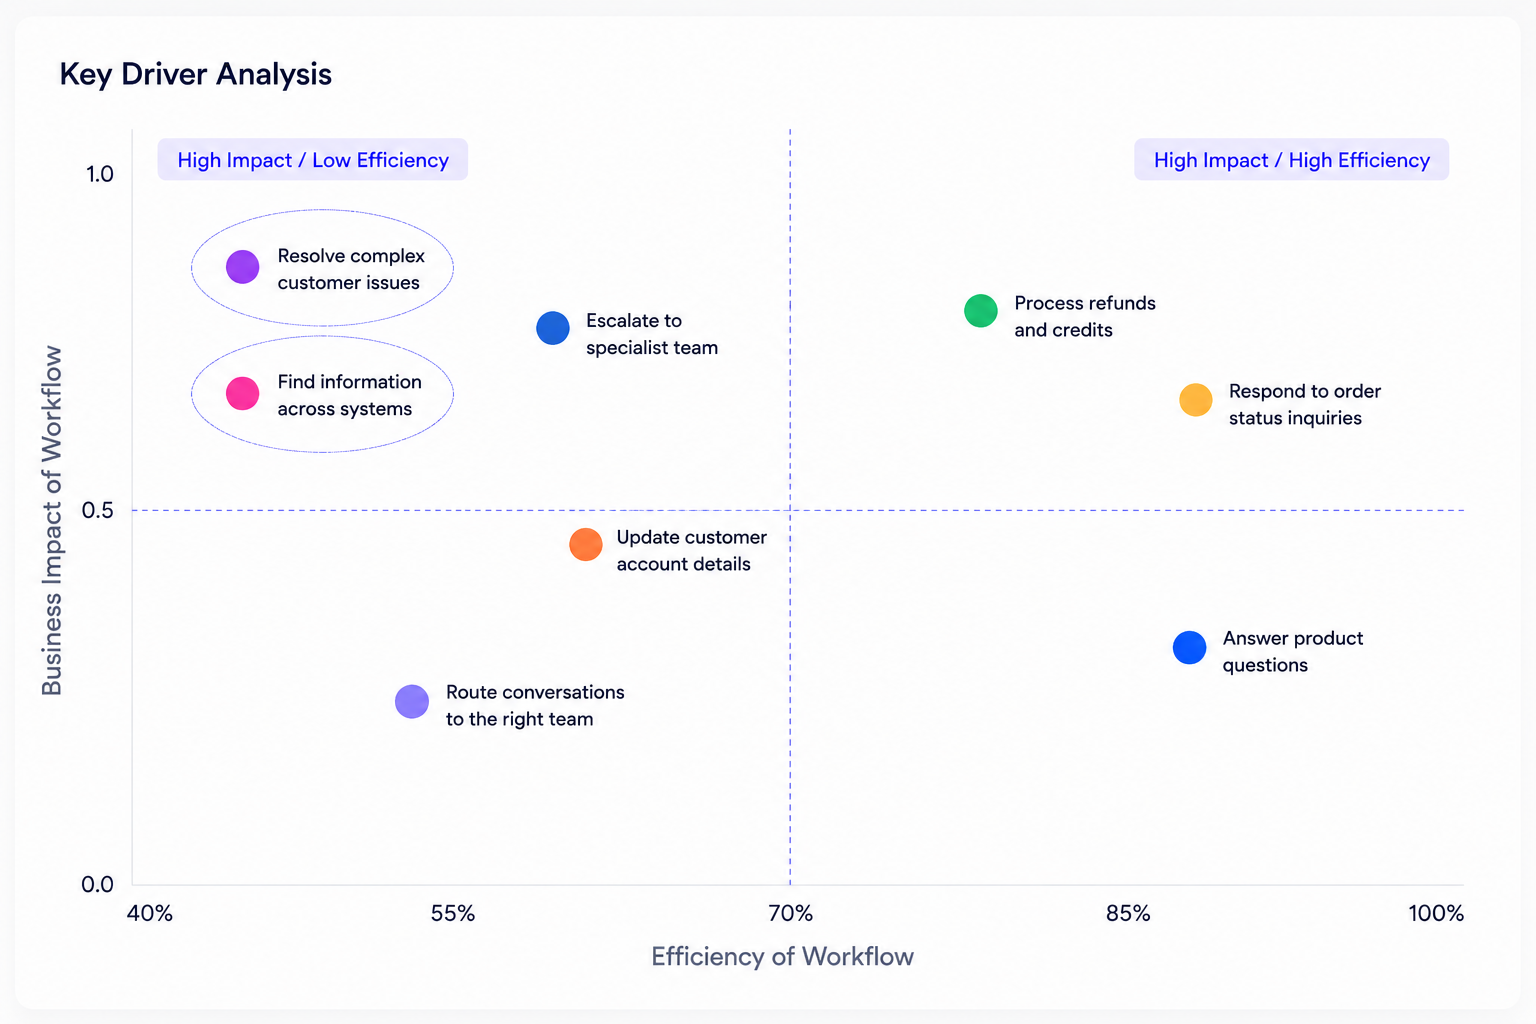
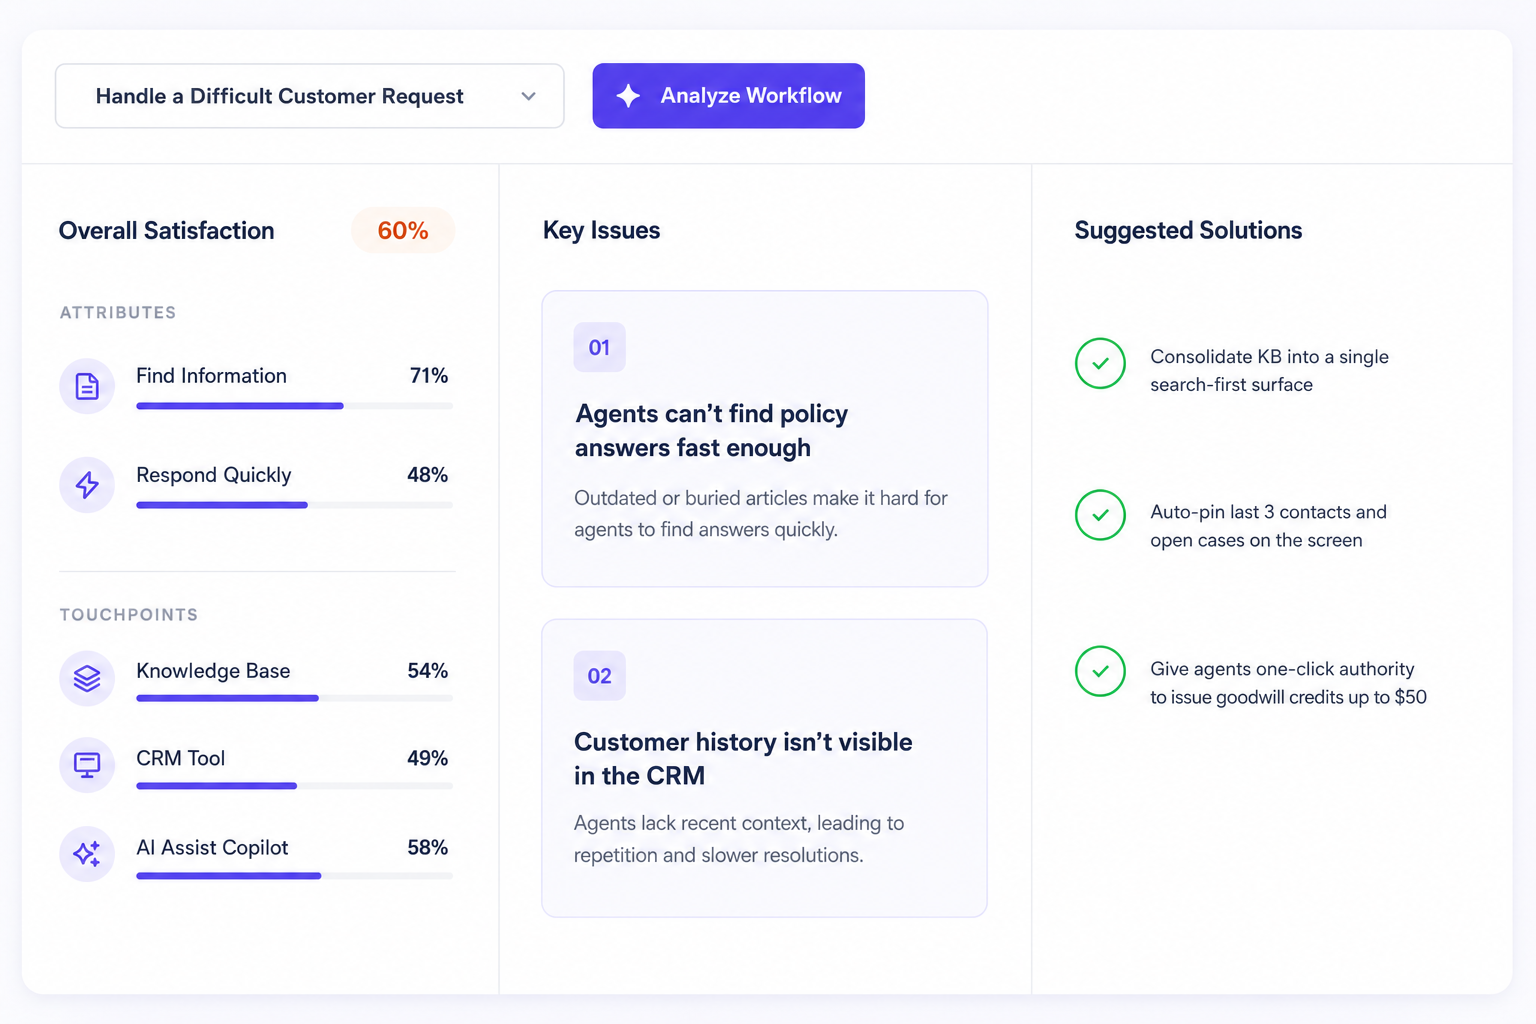
Identify workflows requiring focus
Every workflow gets a scorecard - this quantified workflow data allows you to compare across workflows to prioritize those with most opportunity.
Route workflow insights to the right owner
Workflow insights feed AI, IT, Ops, and HR and the AI agents themselves. Each owner sees what they uniquely can fix in context of the workflow. No more siloed dashboards. No more conflicting priorities.
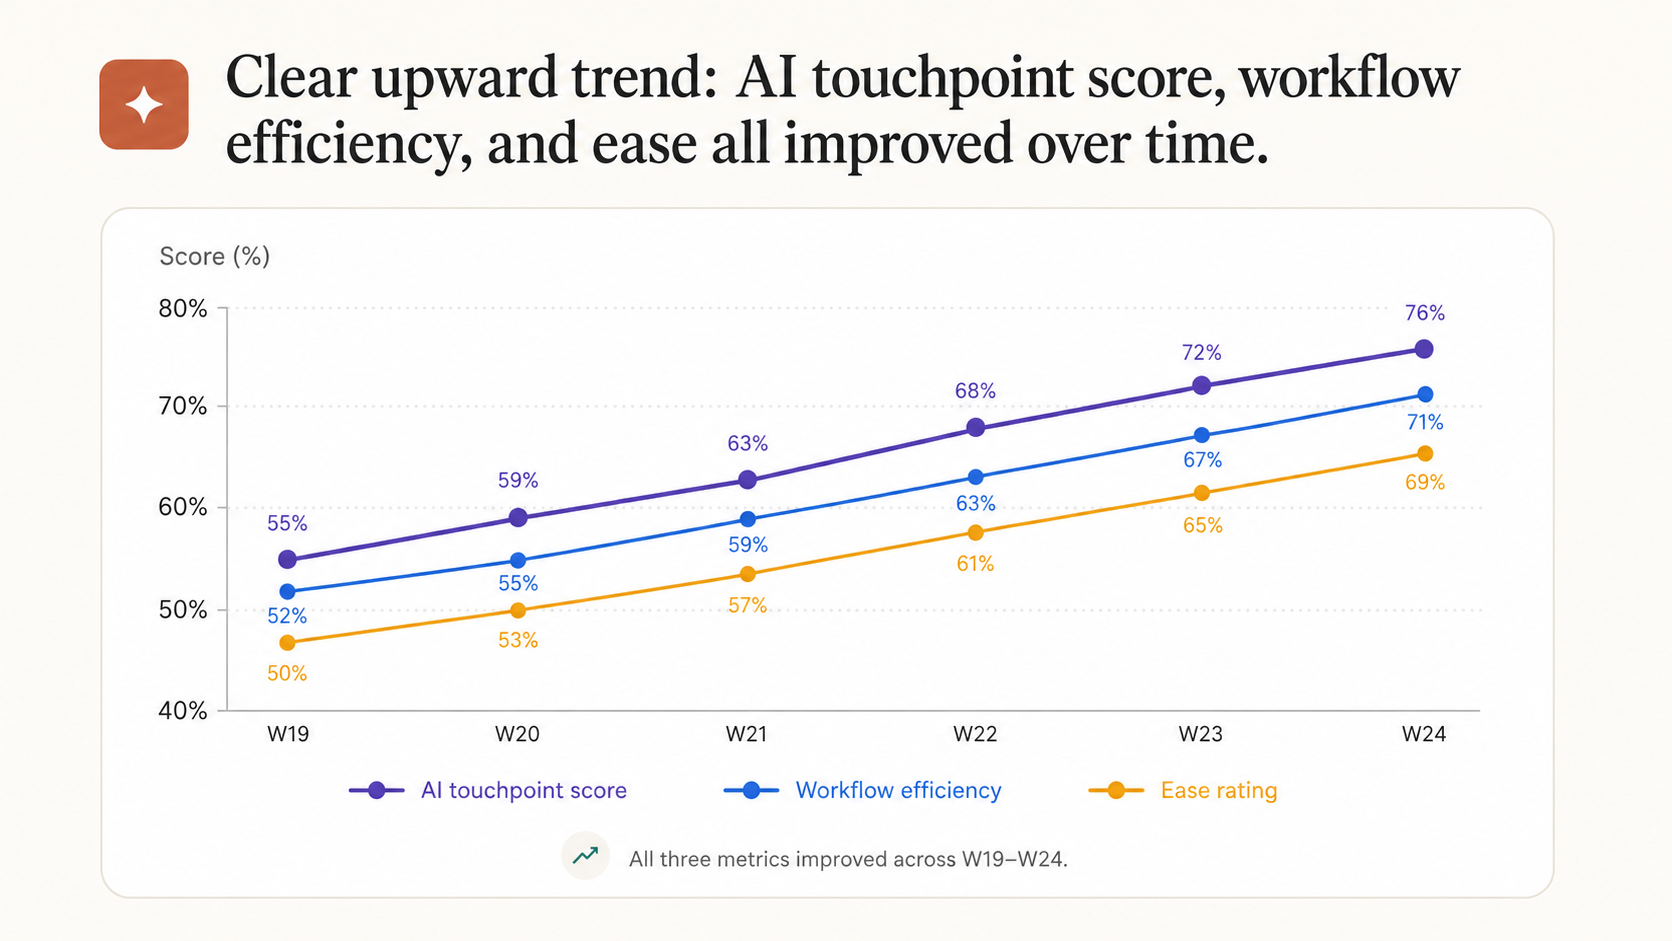
Monitor the impact of your actions
FOUNT remeasures the workflow as it changes so you can confirm whether the enablers you’ve deployed (e.g. AI) actually made it better, easier, and faster.
Annual cost savings
time saved across employee workflows
hours in released capacity annually
employee satisfaction
score in ai tools adoption
.svg)
FOUNT is helping us unlock value by revealing where friction exists across any employee workflow we care to accelerate. We are relying on it to build a sustainable, scalable model to understand how our HR products and services are performing from our customers point of view to drive continuous improvement. It's also helping us evolve and transform work with AI, bringing critical insights on time spent and friction in job-specific workflows.
.png)
Staff VP, HR Transformation
.svg)
The core details that [FOUNT] data provides is what is so valuable. We're not guessing. We have a lot of very clear indications of where we need to focus, and the ability to see improvement over time as we make interventions and decide how to invest and focus on the things that will add the most value. It helps get everybody on the same page and aligns us around this broader objective, which is why we're really trying to look at experience from an end to end cross functional perspective.
Sr. Vice President, Head Global HR Operations and Shared Services
Unlike any provider out there, FOUNT’s unique approach to experience measurement and friction identification is helping us scale an approach to make work better, easier, faster for our employees and drive superior customer experiences.
SVP Experience (Customer and Employee)
That data pinpointed exactly where bottlenecks occur, which segments have the most challenges, and the relative severity of each friction point. This clarity has been invaluable in helping us to prioritize our improvements to maximize impact…
.png)
David Gill
FOUNT has been an invaluable partner throughout our transformation journey. Their data has provided unmatched clarity into the real experiences of our sales and recruiting teams, helping us identify high-impact friction points and prioritize what matters most. Their exceptional support during large-scale change initiatives has equipped us to navigate complexity with confidence, align feedback across priority projects and accelerate adoption of new ways of working.!
.png)
Michelle Webb
Resources
Fresh perspectives about reducing work friction and improving employee experiences.
LIVE Webinar – July 9th for SSON Network. Beyond AI Hype: How to De-Risk Your GBS Transformation with Friction Data
LIVE Webinar | July 9th | 10 AM EDT
Today, ambitious GBS leaders are expanding the way they define transformative business value. Whilst their goals are growing, the data they use to de-risk their transformation hasn’t changed much.
This webinar will spotlight how GBS leaders are fixing a bigger problem: the way they measure work.
Process Mining, SLAs, and ticketing systems only tell what happens after something goes wrong. They don’t show how to prevent problems before they start.
In this session, you’ll hear real stories from leading GBS teams using a new kind of data – called friction data – to find and fix what slows workers down and leads them to reject new digital and AI-powered GBS tools.
In this session, you’ll hear how GBS teams are using friction data to:
✔ Accelerate AI and digital tool adoption
✔ Bridge silos and unify service delivery
✔ Free up to 2 hours of productive time per worker, per day
What You’ll Learn:
- Why friction data is a leading indicator for successful digital and AI adoption
- How to apply a proven framework to proactively measure day-to-day friction
- How a unified friction data model creates better GBS experiences across HR, Finance, Procurement, and IT

Speakers
Christophe Martel
CEO and Co-Founder, FOUNT Global
Christophe Martel is the co-founder and CEO of FOUNT, a SaaS platform that helps companies identify and remove work friction. He has 30 years of experience helping organizations improve the way their people work. He was formerly Chief Human Resources Officer at talent management and employee experience consulting firm CEB, which sold to Gartner for $2.7 billion in 2017.
Stephanie Denino
Director of Applied EX practice, TI People
Stephanie Denino is the Director of Applied EX practice at TI People – an employee experience consultancy (EX). Stephanie works with leaders who are eager to shape and apply the practices that will allow them to systemically improve experiences for and with their people.
Lucy Hughes
Senior Vice President, Head Global HR Operations and Shared Services, PepsiCo
Lucy Hughes is a strategic HR executive at PepsiCo with deep expertise in HR services, systems, and global shared services. She brings extensive experience in talent management, organizational development, and transformation, consistently leading complex, outcome-driven projects. Known for driving sustainable performance and large-scale change, Lucy excels in identifying key challenges and delivering impactful, results-focused solutions.
.svg)
General FAQs
FOUNT is a workflow intelligence platform. It tells you where work actually breaks down — capturing effort, time, and friction at the workflow level across tools, processes, and teams. It connects that data to the right owners (humans or AI agents) so they know exactly what to fix.
FOUNT is built for operating leaders accountable for the performance of work being changed by AI - Chief AI Officers, COOs, Heads of Transformation, and CTOs. Function and Department-level leaders in Engineering, HR, Sales, Customer Service, Finance and GBS roles use it to own specific workflow improvements.
Most approaches measure tool adoption or satisfaction. FOUNT measures the workflows themselves, asking the workers running them what’s helping, what’s not, and what they’d change. It takes 90 seconds per worker, 50 responses per workflow. It runs through the LLM your team already uses via MCP, combines with other operational data already available in your AI environment, and routes action to the right owners, including AI agents.
AI is changing how work gets done faster than most organizations can measure. Every function is rolling out new tools, redesigning processes, and deploying agents - but what workers actually know about those changes stays trapped in meetings, message threads and silent workarounds.
FOUNT offers options such as a 6-week proof of concept, pilot programs, or license agreements. Pricing depends on scope and scale. Contact our Sales Team for details.
FOUNT asks workers directly a series of targeted questions about their workflows. Each measurement takes 90 seconds per person and requires around 50 responses to surface sharp, actionable insights on a single workflow.
.svg)